The currency adjusted pricing environment in July was again positive.
Cargo capacity increased 1.4% year-on-year, while cargo sales were up 8.4% in revenue ton-kilometer terms. As a result, the Cargo load factor showed a corresponding improvement, rising 4.3 percentage points in the month.
The Network Airlines Lufthansa German Airlines, Swiss and Austrian Airlines carried 9.7 million passengers in July, 5.1% more than the previous year’s month. Compared to the previous year, the available seat kilometers increased by 2.7% in July. The sales volume was up 3.4% over the same period, raising the seat load factor by 0.6 percentage points to 86.7%.
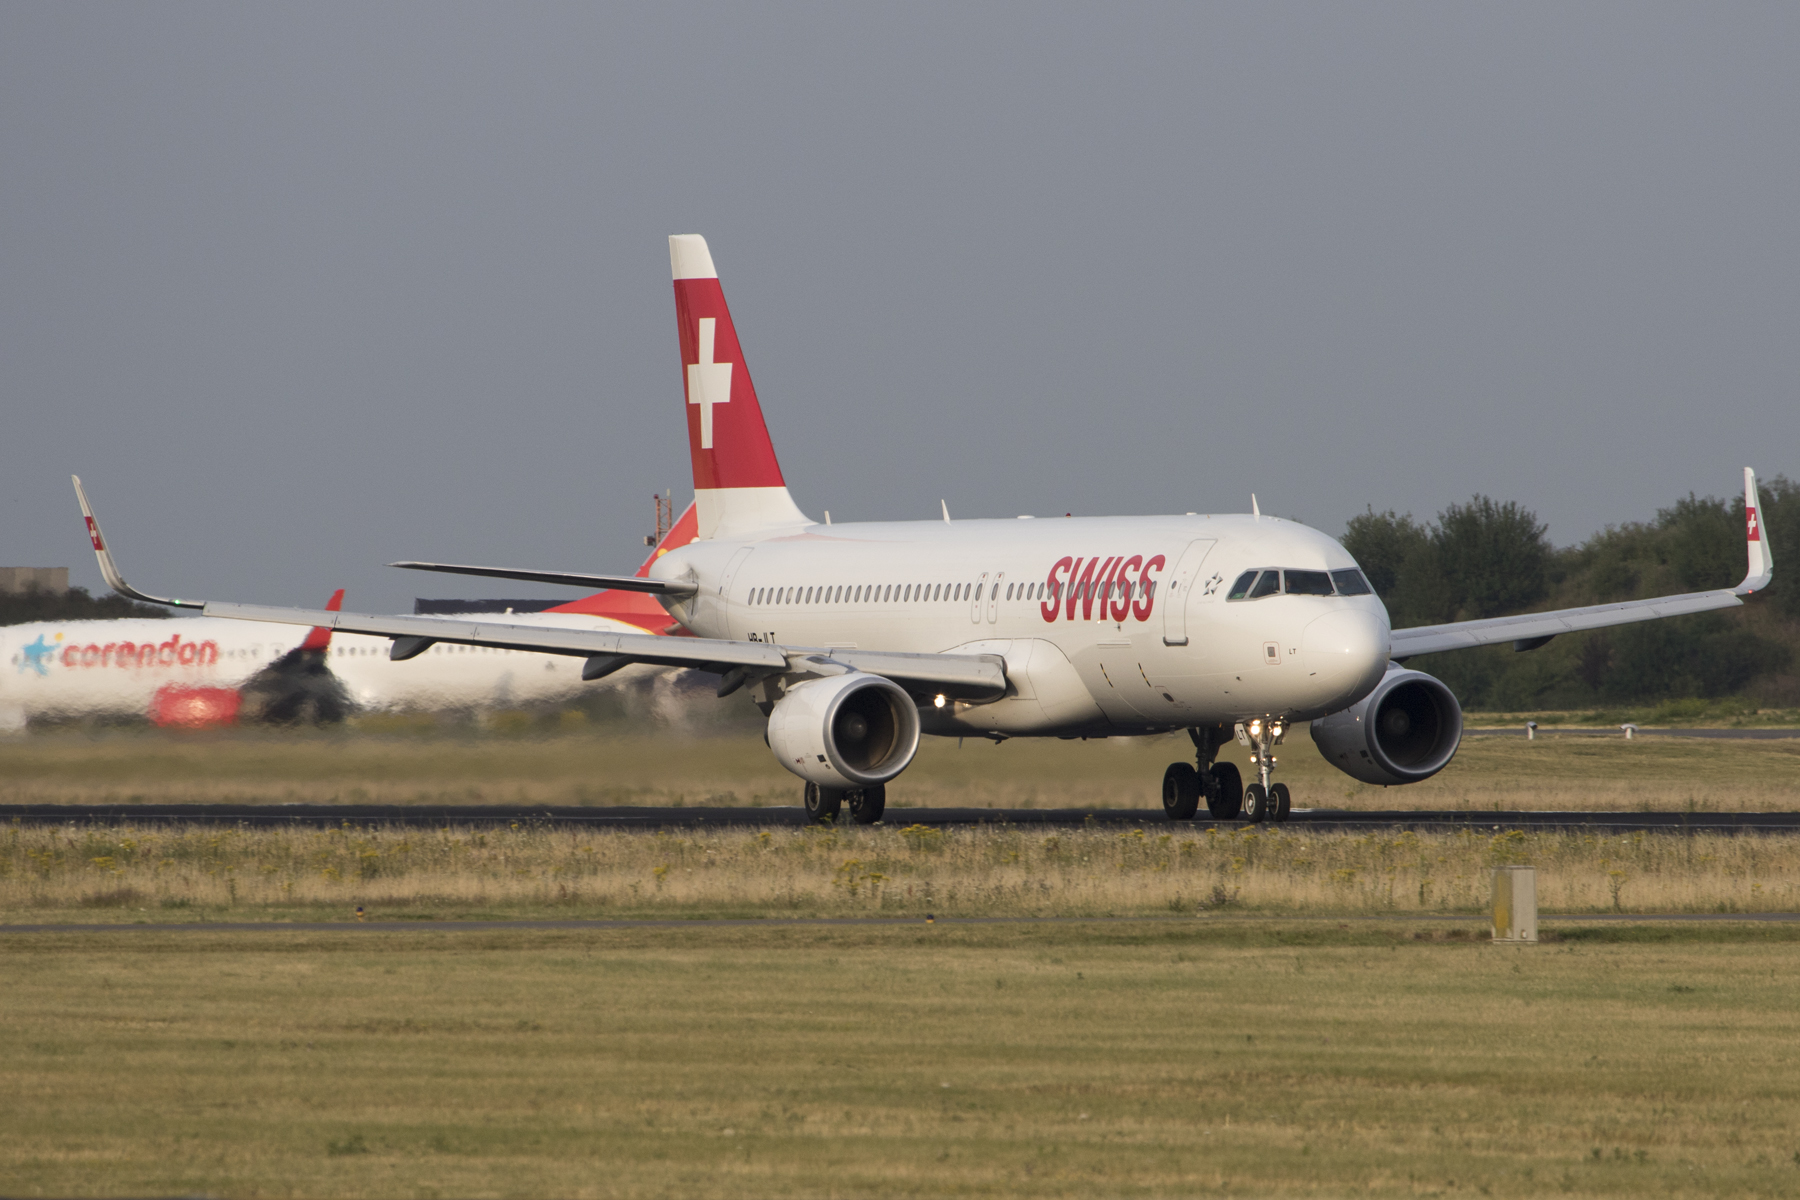
Lufthansa German Airlines carried more than 6.4 million passengers in July, a 3.3% increase compared to the same month last year. A 1.1% increase in seat kilometers in July faced a 2% increase in sales. Hence, the seat load factor was up to 86.8%, therefore 0.8 percentage points above the prior-year level.
The Lufthansa Group’s Point-to-Point Airlines – Eurowings (including Germanwings) and Brussels Airlines – carried around 3.4 million passengers in July. Among this total, about 3.1 million passengers were on short-haul flights and 240,000 flew long-haul. This amounts to an increase of 73.2% in comparison to the previous year. July capacity was 105.8% above its prior-year level, while its sales volume was up 103.5%, resulting in a one percentage points lower seat load factor of 84.7% at the Point-to-Point Airlines. On the short-haul services, the available seat kilometers increased by 67.5%, at the same time, sales increased by 67.2% in the same period. This resulted in a nearly stable seat load factor, 0.1% below July 2016. The seat load factor for the long-haul services decreased by 7.4 percentage points to 85.6% during the same period. Here a 337.5% increase in supply faced a 302.5% increase in sales.
| Lufthansa Group | |||||
|---|---|---|---|---|---|
| Month | yoy | Cumulative | yoy | ||
| Total Lufthansa Group Airlines | Passengers in 1,000 | 13,060 | +16.9% | 73,052 | +17.2% |
| Available seat-kilometers (m) | 30,814 | +12.4% | 185,054 | +11.8% | |
| Revenue seat-kilometers (m) | 26,599 | +12.8% | 148,480 | +15.1% | |
| Passenger load-factor (%) | 86.3 | +0.3pts. | 80.2 | +2.3pts. | |
| Available Cargo tonne-kilometers (m) | 1,386 | +1.4% | 8,906 | +2.9% | |
| Revenue Cargo tonne-kilometers (m) | 931 | +8.4% | 6,150 | +8.1% | |
| Cargo load-factor (%) | 67.2 | +4.3pts. | 69.1 | +3.3pts. | |
| Number of flights | 104,836 | +11.8% | 648,485 | +8.9% | |
| Lufthansa German Airlines | Passengers in 1,000 | 6,443 | +3.3% | 37,669 | +4.5% |
| Available seat-kilometers (m) | 17,631 | +1.1% | 108,638 | +0.5% | |
| Revenue seat-kilometers (m) | 15,296 | +2.0% | 88,027 | +4.4% | |
| Passenger load-factor (%) | 86.8 | +0.8pts. | 81.0 | +3.0pts. | |
| Number of flights | 48,890 | -0.9% | 313,066 | -2.1% | |
| SWISS | Passengers in 1,000 | 1,872 | +1.6% | 10,636 | +5.3% |
| Available seat-kilometers (m) | 5,172 | +3.8% | 32,027 | +7.4% | |
| Revenue seat-kilometers (m) | 4,501 | +4.4% | 25,965 | +10.5% | |
| Passenger load-factor (%) | 87.0 | +0.5pts. | 81.1 | +2.3pts. | |
| Number of flights | 14,890 | -5.0% | 94,986 | -3.3% | |
| Austrian Airlines | Passengers in 1,000 | 1,387 | +14.8% | 7,172 | +13.8% |
| Available seat-kilometers (m) | 2,706 | +9.8% | 15,004 | +8.0% | |
| Revenue seat-kilometers (m) | 2,307 | +9.5% | 11,351 | +8.5% | |
| Passenger load-factor (%) | 85.3 | -0.2pts. | 75.7 | +0.3pts. | |
| Number of flights | 13,646 | +8.9% | 81,924 | +5.5% | |
| Total Network Airlines* | Passengers in 1,000 | 9,702 | +5.1% | 55,189 | +5.8% |
| Available seat-kilometers (m) | 25,509 | +2.7% | 155,489 | +2.5% | |
| Revenue seat-kilometers (m) | 22,104 | +3.4% | 125,207 | +5.9% | |
| Passenger load-factor (%) | 86.7 | +0.6pts. | 80.5 | +2.6pts. | |
| Number of flights | 77,426 | +0.8% | 485,804 | -1.2% | |
| * Lufthansa German Airlines incl. regional airlines, SWISS incl. Edelweiss Air, Austrian Airlines | |||||
| Total Point-to-Point Airlines* | Passengers in 1,000 | 3,358 | +73.2% | 17,863 | +75.5% |
| Available seat-kilometers (m) | 5,305 | +105.8% | 29,565 | +113.7% | |
| Revenue seat-kilometers (m) | 4,495 | +103.5% | 23,273 | +115.0% | |
| Passenger load-factor (%) | 84.7 | -1.0pts. | 78.7 | +0.5pts. | |
| Number of flights | 26,628 | +64.7% | 157,245 | +59.7% | |
| * Incl. Eurowings and Brussels Airlines | |||||
| Additional references | |||||
| Pricing environment | Positive (excl. currency) | ||||
| Comments | |||||
| Next Investor Info | 11 September 2017 | ||||
| Network Airlines & Cargo* | |||||
| By region | Month | yoy | Cumulative | yoy | |
| Europe | Passengers in 1,000 | 7,421 | +5.7% | 42,147 | +5.7% |
| Available seat-kilometers (m) | 7,540 | +4.7% | 44,463 | +3.1% | |
| Revenue seat-kilometers (m) | 6,221 | +6.4% | 33,613 | +6.3% | |
| Passenger load-factor (%) | 82.5 | +1.3pts. | 75.6 | +2.2pts. | |
| Available Cargo tonne-kilometers (m) | 63 | -6.8% | 416 | -4.9% | |
| Revenue Cargo tonne-kilometers (m) | 31 | +0.2% | 214 | -0.3% | |
| Cargo load-factor (%) | 48.4 | +3.4pts. | 51.5 | +2.4pts. | |
| America (North und South) | Passengers in 1,000 | 1,157 | -0.6% | 6,413 | +3.6% |
| Available seat-kilometers (m) | 9,997 | +0.3% | 59,455 | +2.1% | |
| Revenue seat-kilometers (m) | 8,758 | +0.0% | 48,856 | +4.2% | |
| Passenger load-factor (%) | 87.6 | -0.3pts. | 82.2 | +1.7pts. | |
| Available Cargo tonne-kilometers (m) | 642 | -0.4% | 4,043 | +2.2% | |
| Revenue Cargo tonne-kilometers (m) | 403 | +7.9% | 2,661 | +7.7% | |
| Cargo load-factor (%) | 62.8 | +4.9pts. | 65.8 | +3.3pts. | |
| Asia/Pacific | Passengers in 1,000 | 662 | +1.9% | 3,940 | +5.6% |
| Available seat-kilometers (m) | 5,914 | +0.7% | 37,466 | +0.3% | |
| Revenue seat-kilometers (m) | 5,363 | +1.7% | 31,785 | +6.0% | |
| Passenger load-factor (%) | 90.7 | +0.9pts. | 84.8 | +4.5pts. | |
| Available Cargo tonne-kilometers (m) | 554 | +3.8% | 3,597 | +5.0% | |
| Revenue Cargo tonne-kilometers (m) | 427 | +8.4% | 2,814 | +9.8% | |
| Cargo load-factor (%) | 77.1 | +3.3pts. | 78.2 | +3.4pts. | |
| Middle East/ Africa | Passengers in 1,000 | 462 | +15.2% | 2,689 | +12.3% |
| Available seat-kilometers (m) | 2,059 | +13.8% | 14,105 | +9.0% | |
| Revenue seat-kilometers (m) | 1,762 | +17.2% | 10,952 | +13.0% | |
| Passenger load-factor (%) | 85.6 | +2.5pts. | 77.6 | +2.7pts. | |
| Available Cargo tonne-kilometers (m) | 126 | +4.8% | 850 | +2.0% | |
| Revenue Cargo tonne-kilometers (m) | 70 | +15.6% | 459 | +4.0% | |
| Cargo load-factor (%) | 55.5 | +5.1pts. | 54 | +1.0pts. | |
| * Lufthansa German Airlines incl. regional airlines, SWISS incl. Edelweiss Air, Austrian Airlines, Lufthansa Cargo | |||||
| Point-to-Point Airlines* | |||||
| Month | yoy | Cumulative | yoy | ||
| Short-haul | Passengers in 1,000 | 3,115 | +65.1% | 16,443 | +66.8% |
| Available seat-kilometers (m) | 3,705 | +67.5% | 19,774 | +72.4% | |
| Revenue seat-kilometers (m) | 3,125 | +67.2% | 15,196 | +75.5% | |
| Passenger load-factor (%) | 84.3 | -0.1pts. | 76.8 | +1.4pts. | |
| Long-haul | Passengers in 1,000 | 243 | +362.1% | 1,420 | +347.8% |
| Available seat-kilometers (m) | 1,600 | +337.5% | 9,791 | +314.2% | |
| Revenue seat-kilometers (m) | 1,370 | +302.5% | 8,077 | +273.4% | |
| Passenger load-factor (%) | 85.6 | -7.4pts. | 82.5 | -9.0pts. | |
| * Incl. Eurowings and Brussels Airlines | |||||
This post was published on 9 August 2017 13:35
Lufthansa will end Airbus A340-600 passenger operations on 18 October, with the final scheduled service…
A technical failure affecting Italy’s air traffic control systems disrupted flights at Brussels Airport on…
Red Sea Airlines) charter flight 4S321 from Hurghada, Egypt, to St. Petersburg, Russian Federation, operated…
Airbus is preparing to decide on an expansion of A350 production capacity as airlines seek…
Ryanair responded to a passenger’s complaint about its windowless seat 11A with a characteristic social-media…
VINCI Airports has launched the redevelopment of Terminal 2 at Lyon-Saint Exupéry Airport, with opening…