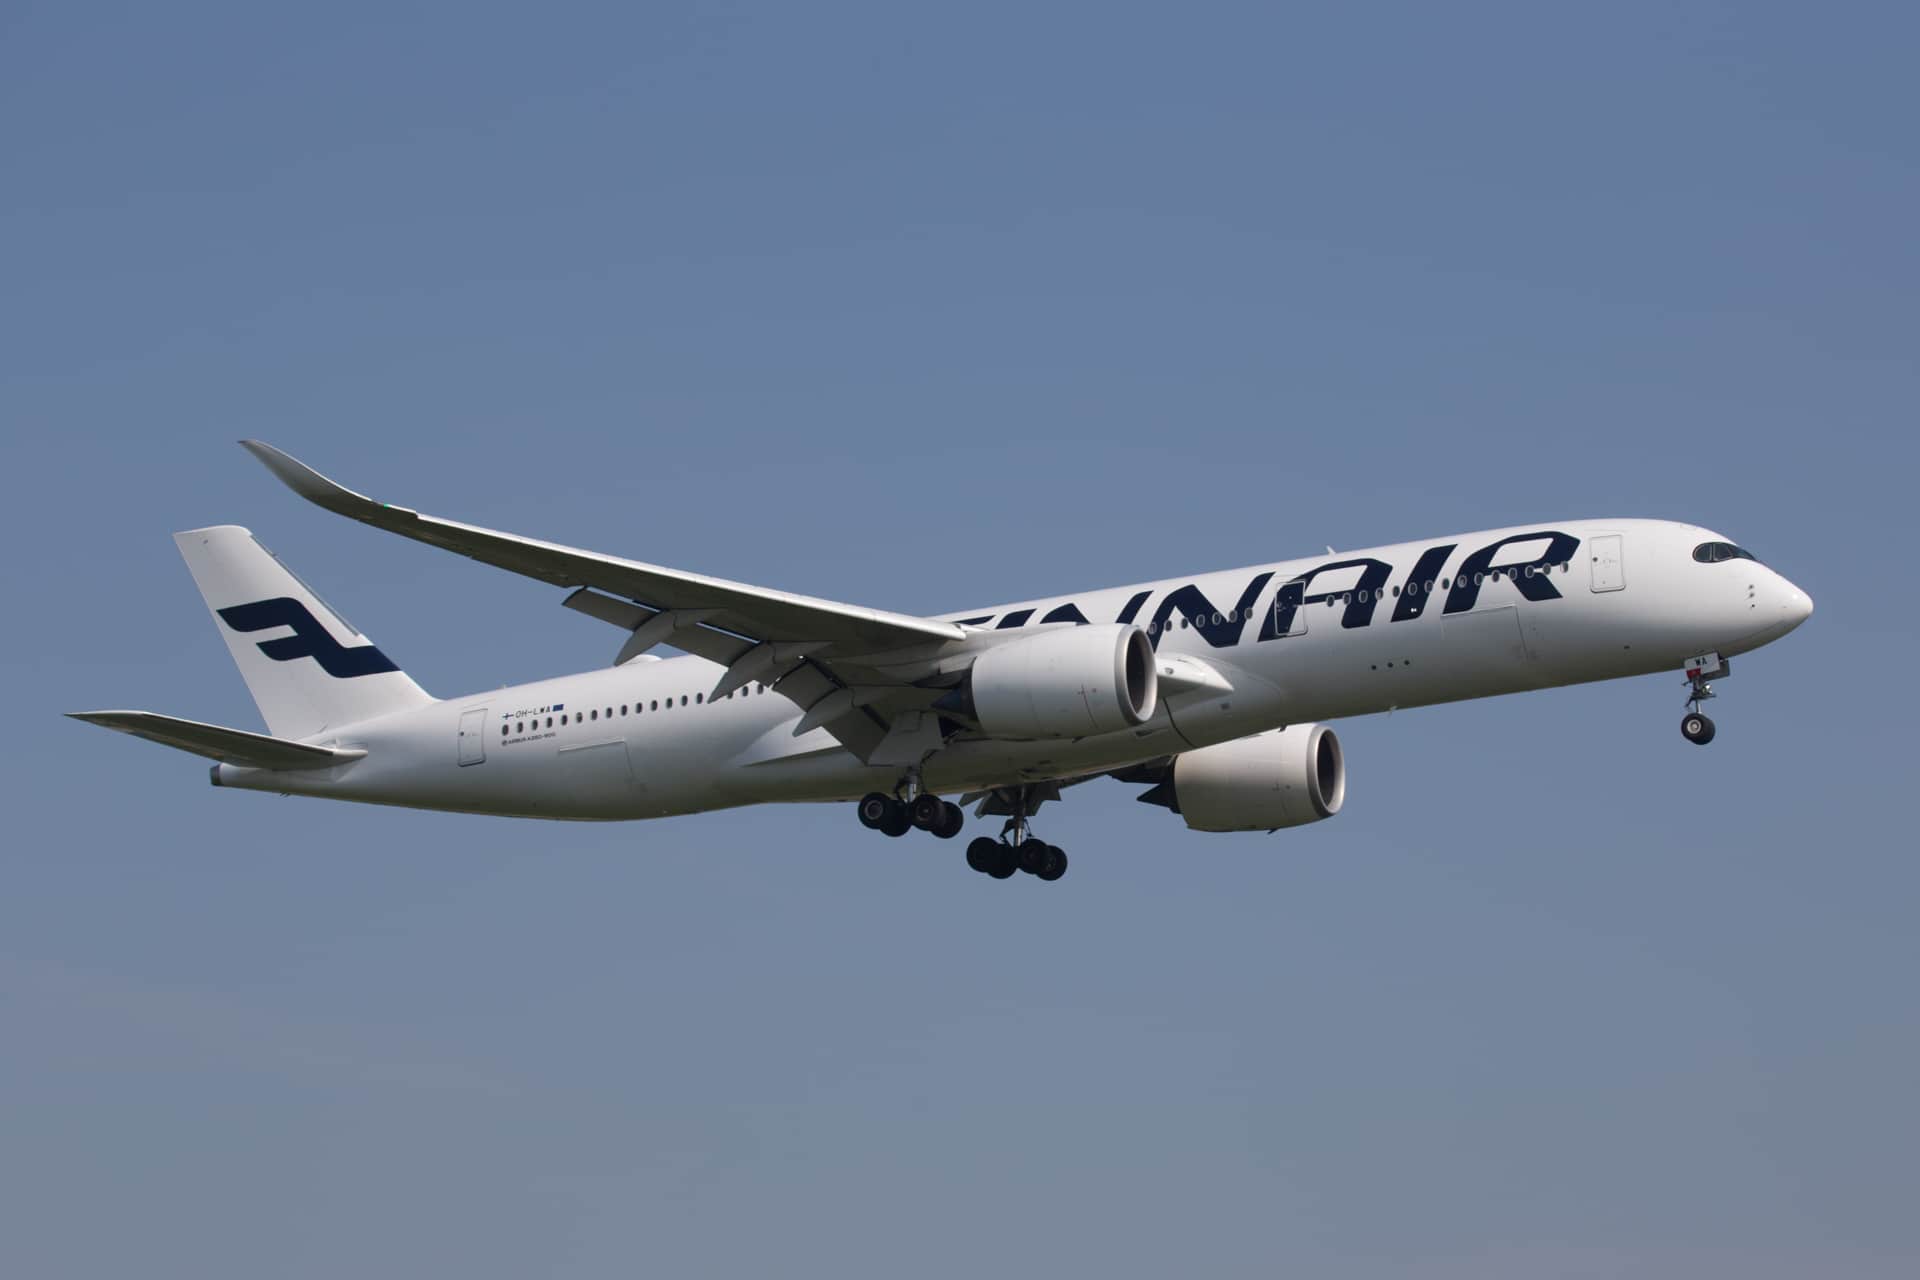
In December, Finnair carried 92,500 passengers, which was 92.0% less than in the corresponding period of 2019 but 8.8% more than in November 2020. The COVID-19 impact, including the exceptionally strict travel restrictions imposed by Finland, still affected all passenger traffic figures. It was visible especially in the North Atlantic figures (no scheduled flights in December).
The overall capacity measured in Available Seat Kilometres (ASK) decreased in December by 90.1% year-on-year. Finnair operated 75 daily flights (cargo-only included) on average which was 21.5% compared to December 2019. The differences between capacity figures are explained by the shorter operated flights on average and by smaller operated aircraft compared to December 2019. Finnair’s traffic measured in Revenue Passenger Kilometres (RPKs) decreased by 96.1%. The Passenger Load Factor (PLF) decreased by 47.1% points to 30.1%.
The ASK decline in Asian traffic was 89.5%. The North Atlantic capacity decreased by 100.0%. In European traffic, the ASKs were down by 91.3%. The ASKs in domestic traffic decreased by 73.8%.
RPKs decreased in Asian traffic by 98.3%, in North Atlantic traffic by 100.0%, in European traffic by 94.3% and in domestic traffic by 79.4%.
The PLF was 12.4% in Asian traffic but it was supported by the strong cargo operations and a high cargo load factor. The PLF was 50.0% in European traffic and 52.2% in domestic traffic, whereas there was no PLF figure in North Atlantic traffic due to zero passenger flights in December.
Passenger numbers decreased in Asian traffic by 98.3%, in North Atlantic traffic by 100.0%, in European traffic by 93.3% and in domestic traffic by 82.2%.
Available scheduled cargo tonne kilometres decreased by 87.1% year-on-year and revenue scheduled cargo tonne kilometres decreased by 81.0%, both due to the impact of the COVID-19 pandemic on scheduled flights. However, cargo related available tonne kilometres decreased by 61.6% and revenue tonne kilometres only by 42.4% as they both include also the cargo-only flights operated mainly between Europe and Asia as well as Europe and North America. Cargo-only tonnes were down by 13.4% and the total cargo tonnes by 12.2% from November 2020 due to softer demand during the holiday season. Despite it, strong demand for the cargo capacity especially in Asia continued. As a result, the cargo load factor was clearly higher than in the corresponding period of 2019.
In December, 89.3% of all Finnair flights arrived on schedule (81.4%).
Traffic statistics for January 2021 will be published on Friday 5 February 2021.
| Finnair Traffic Performance December 2020 | ||||
| Month | % Change | YTD | % Change | |
| Total traffic | ||||
| Passengers 1,000 | 92.5 | -92.0 | 3,485.6 | -76.2 |
| Available seat kilometres mill | 387.9 | -90.1 | 12,937.5 | -72.6 |
| Revenue passenger kilometres mill | 116.9 | -96.1 | 8,150.0 | -78.8 |
| Passenger load factor % | 30.1 | -47.1p | 63.0 | -18.7p |
| Cargo tonnes total | 6,809.4 | -50.7 | 71,732.8 | -58.6 |
| Available tonne kilometres mill | 136.5 | -76.4 | 2,436.5 | -64.8 |
| Revenue tonne kilometres mill | 59.6 | -83.2 | 1,213.6 | -73.3 |
| Asia | ||||
| Passengers 1,000 Asia | 3.5 | -98.3 | 501.3 | -80.4 |
| Available seat kilometres mill Asia | 208.4 | -89.5 | 6,155.9 | -73.6 |
| Revenue passenger kilometres mill Asia | 25.9 | -98.3 | 3,837.7 | -80.1 |
| Passenger load factor % Asia | 12.4 | -65.3p | 62.3 | -20.6p |
| Europe | ||||
| Passengers 1,000 Europe | 45.2 | -93.3 | 2,033.2 | -78.1 |
| Available seat kilometres mill Europe | 121.2 | -91.3 | 5,061.1 | -71.7 |
| Revenue passenger kilometres mill Europe | 60.6 | -94.3 | 3,140.5 | -78.3 |
| Passenger load factor % Europe | 50.0 | -27.3p | 62.1 | -18.8p |
| North Atlantic | ||||
| Passengers 1,000 North Atlantic | 0.0 | -100.0 | 82.3 | -82.0 |
| Available seat kilometres mill North Atlantic | 0.0 | -100.0 | 848.9 | -79.1 |
| Revenue passenger kilometres mill North Atlantic | 0.0 | -100.0 | 647.1 | -81.4 |
| Passenger load factor % North Atlantic | N/A | N/A | 76.2 | -9.1p |
| Domestic | ||||
| Passengers 1,000 Domestic | 43.8 | -82.2 | 868.8 | -63.4 |
| Available seat kilometres mill Domestic | 58.2 | -73.8 | 871.5 | -54.7 |
| Revenue passenger kilometres mill Domestic | 30.4 | -79.4 | 524.7 | -58.4 |
| Passenger load factor % Domestic | 52.2 | -14.2p | 60.2 | -5.4p |
| Cargo Traffic | ||||
| Europe tonnes | 243.0 | -92.4 | 9,067.6 | -74.2 |
| North Atlantic tonnes | 0.0 | -100.0 | 2,542.2 | -81.3 |
| Asia tonnes | 2,095.5 | -78.3 | 33,746.9 | -72.8 |
| Domestic tonnes | 31.2 | -15.0 | 340.3 | -40.5 |
| Cargo scheduled traffic total tonnes | 2,369.7 | -82.8 | 45,697.0 | -73.6 |
| Cargo flights, tonnes** | 4,439.7 | 100.0 | 26,035.8 | 100.0 |
| Cargo Traffic tonnes total | 6,809.4 | -50.7 | 71,732.8 | -58.6 |
| Available tonne kilometres* mill | 58.2 | -61.6 | 718.8 | -61.6 |
| Revenue tonne kilometres mill | 49.3 | -42.4 | 485.4 | -55.6 |
| Available sched. cargo tonne kms*, mill | 19.6 | -87.1 | 489.2 | -73.9 |
| Revenue sched. cargo tonne kms, mill | 16.3 | -81.0 | 293.2 | -73.2 |
| Cargo load factor* % | 84.7 | 28.2p | 67.5 | 9.1p |
| – North-Atlantic cargo load factor* % | N/A | N/A | 66.3 | 10.2p |
| – Asia cargo load factor* % | 87.0 | 26.4p | 65.1 | 1.8p |
| Scheduled traffic Cargo load factor*, % | 83.2 | 26.7p | 59.9 | 1.6p |
* Based on average operational cargo capacity
** Including purchased traffic
This post was published on 7 January 2021 08:09
Qantas cancelled its Rome–Perth service on Saturday after passengers on the preceding flight from Perth…
Boeing delivered 161 commercial aircraft in the third quarter of 2026, bringing its January–September total…
Frankfurt Airport handled 6.1 million passengers in September 2026, up 1.6% year on year, supported…
Cirium forecasts around 43,000 commercial passenger and freighter aircraft deliveries between 2026 and 2045, worth…
ICAO has joined the Supporting Alliance for CORSIA EEU Supply, strengthening efforts to increase the…
Nuremberg Airport temporarily suspended operations on Tuesday, 13 October, after an emergency alert involving a…